OLA and AQP
March 23, 2021
Garcia-Molina/Ullman/Widom: (readings only)
What is the best, correct technique for task X, when Y is true?
- How do you define Correct and Best?
- What correct alternatives are available?
- How do you find the best available alternative
So Far: Correct = The original RA for a query.
Only queries guaranteed to produce identical results are correct
What happens when Correct allows for a margin of error?
- Aggregate query with some margin of error.
ORDER BY LIMIT(Top-K) with some margin of error.LIMITwithoutORDER BY(Any-K).
Sacrifice a little accuracy for a lot of speed
Online Aggregation
Approximate Query Processing
SELECT SUM(A) FROM R
Naively, you need to see all values of R.A
Online Aggregation
$Avg(3,6,10,9,1,3,9,7,9,4,7,9,2,1,2,4,10,8,9,7) = 6$
$Avg(3,6,10,9,1) = 5.8$ $\approx 6$
$Sum\left(\frac{k}{N}\; Samples\right) \cdot \frac{N}{k} \approx Sum(*)$
Sampling lets you approximate aggregate values with orders of magnitude less data.
Question: How accurate is an estimate from $N$ samples
With $n$ tuples sampled uniformly with replacement
| $|AVG(samples) - AVG(real)|$ | The absolute error |
| $P(|AVG(samples) - AVG(real)| \geq \epsilon)$ | Its probability of exceeding error threshold $\epsilon$ |
| $P(|AVG(samples) - AVG(real)| \geq \epsilon) \leq 2e^{\frac{2n\epsilon^2}{(max(real) - min(real))^2}}$ | ... is below a threshold based on $\epsilon$, $n$, and the min/max value. |
"Hoeffding's Bound"
See also "Chernoff's Bound" (similar) and "Serfling's Bound" (works without replacement).
What about non-sum-based aggregates?
Bootstrapping
Idea 1: Generate a bunch of samples of the same size and see how they're distributed.
The resulting histogram models the distribution of samples.
Problem: Generating samples is expensive!
Idea 2: Generate one sample, then resample to see how its distributed
The resulting histogram still models (in expectation) the distribution of samples.
Error Bounds
- SUM, COUNT, AVG (sampling with replacement)
- Hoeffding's Bound
- Chernoff's Bound
- SUM, COUNT, AVG (sampling without replacement)
- Serfling's Bound
- Any Other Aggregate
- Bootstrapping

Keep adding samples until you reach a target accuracy
Keep adding samples until you run out of time
Generating Samples
- Sampling From Disk
- Random seeks are slow
- Sampling For Group-By or Selections
- Low-frequency events don't get sampled
- Sampling From Joins
- Fixing the Birthday Paradox
Sampling From Disk
Idea 1: Pick Randomly!
      for i from 1 to num_samples:
        sample_id = random(0, num_records)
        samples += [ table.where( rowid = sample_id ) ]

Problem: Random scans are EXPENSIVE.
Idea 2: Assume data already randomized!
Pick a random start record and read sequentially from there.

Problem: Sequential records are almost never IID.
Idea 3: Prebuild samples!
Shuffle data into fixed size sample buckets (e.g., BlinkDB).
Sampling From Group-By
| Employee | City | Salary |
|---|---|---|
| Alice | NYC | $120k |
| Bob | NYC | $110k |
| Carol | NYC | $115k |
| Dave | Syracuse | $80k |
SELECT City, AVG(Salary) FROM NYS_Salaries;
Problem: Most data is about NYC. With $N$ samples taken uniformly, margins of error for other cities are much bigger
Stratified Sampling
Generate $\frac{N}{\texttt{COUNT}(\texttt{DISTINCT } City)}$ samples for each group
Use $\texttt{COUNT}(\texttt{DISTINCT } City)$ instead of $\texttt{COUNT}(*)$ as the total group size
Index Striding
Idea 2: Pre-generate sample buckets across a range of different strata (e.g., BlinkDB).
Sampling from Joins
The Birthday Paradox
Assume: $\texttt{UNIQ}(A, R) = \texttt{UNIQ}(A, S) = N$
It takes $O(\sqrt{N})$ samples from both $R$ and $S$
to get even one match.
Weighted Joins
- Exploit Foreign Keys
- Sample from the referencing table, join with full reference tables
- Stratified Sampling
- For many-many joins, stratify on the join attribute(s)
"Join Synopses"
$R \bowtie_B S \bowtie_C T$
- $R.B$ is a foreign key reference to $S.B$
- $S.C$ is a foreign key reference to $T.C$
Sample from R, Use all of S, T
"Join Synopses"
"Join Synopses"
- Foreign keys keep intermediate state small.
- Fast evaluation with INLJ or In-Mem Hash Join.
- Sampling is not biased.
Stratified Sampling
Stratified Sampling
For each tuple sampled from $R$, sample exactly one joining tuple from $S$
Question: Are we biasing the sampling process
Goal: Sample $r \bowtie s$ with probability $p((r\bowtie s) \in R\bowtie S)$
Actual: Sample $r \bowtie s$ with probability $p(r \in R) p((r\bowtie s) \in R\bowtie S | r \in R)$
Bayes' Theorem
$p(r \in R) p((r\bowtie s) \in R\bowtie S) | r \in R)$ $= p(r \in R, (r\bowtie s) \in R\bowtie S)$
$\neq p((r\bowtie s) \in R\bowtie S)$
Corrective Factor
$p(r \in R, (r\bowtie s) \in R\bowtie S)$ $\cdot n$ $= p((r\bowtie s) \in R\bowtie S)$
$n = \frac{ p((r\bowtie s) \in R\bowtie S) }{ p(r \in R, (r\bowtie s) \in R\bowtie S) }$
$ = \frac{ 1 }{ p(r \in R | (r\bowtie s) \in R\bowtie S) } $ $\approx |R| \cdot |\{\;s\;|s \in S, r.A = S.A\;\}$
The probability that a tuple in $R$ participates in a join.
Should I sample from $R$ or $S$ first?
(What if only one tuple from $R$ joins with every tuple from $S$)
"Wander Join"
Sample with all join orders at random.
Convergent Joins
- Ripple Join
- Incrementally increase the sample size
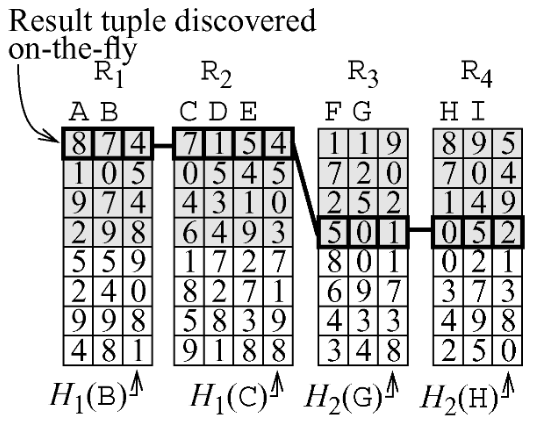
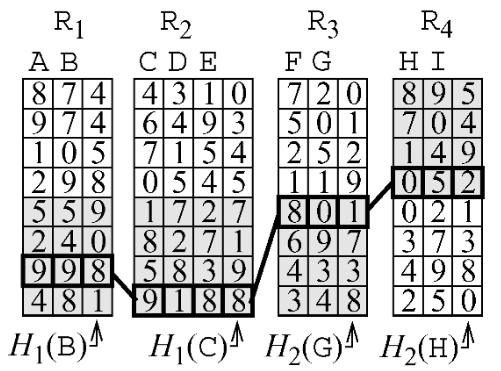
- Turbo DBO Join
- Re-use data loading to get "lucky" joins
Idea 1: Start small, keep making the sample size bigger
Ripple Join
$$Q = R \bowtie S$$- $Q \leftarrow \emptyset$, $R_{sample} \leftarrow \emptyset$, and $S_{sample} \leftarrow \emptyset$
- Sample $r \in R$
- $Q \leftarrow r \bowtie S_{sample}$
- $R_{sample} \leftarrow R_{sample} \uplus \{r\}$
- Sample $s \in S$
- $Q \leftarrow s \bowtie R_{sample}$
- $S_{sample} \leftarrow S_{sample} \uplus \{s\}$
- Goto 2
Ripple Join
Idea 2: Normal BNLJ, but piggyback sampling off of the results.


